Subtotal $0.00


Tracking mango imports in the USA means monitoring official customs and trade data using sources like USDA ERS, USITC DataWeb, U.S. Census Bureau Foreign Trade, and UN Comtrade, all filtered through HS Code 0804.50 to isolate mango-specific shipment records. These databases publish monthly and annual figures covering every origin country, allowing importers, exporters, analysts, and procurement teams to build a precise picture of what enters the U.S. market, when it arrives, and at what declared value. With the right data source and the correct commodity code, anyone can pull verifiable statistics on U.S. mango trade flows without specialized software.
The top suppliers of mangoes to the USA are Mexico, Peru, Brazil, Ecuador, Guatemala, and Haiti, with Mexico commanding more than 80% of total import volume. This dominance reflects geographic proximity, a mature cold-chain infrastructure, and the zero-tariff framework established under the USMCA trade agreement. Peru, Brazil, and Ecuador contribute meaningful but significantly smaller shares, filling seasonal gaps that Mexico cannot cover alone.
U.S. mango import volume has grown consistently over the past decade, driven by rising demand among health-conscious consumers and a growing Hispanic demographic. Recent USDA and USITC data place total annual imports in the range of 900 million to over one billion pounds, with corresponding trade values exceeding one billion USD in peak years. Understanding both the volume and the dollar value side of this market is essential for any importer, distributor, or exporter evaluating entry or expansion into the U.S. mango trade.
Beyond the headline statistics, the picture becomes richer when you examine real-time shipment tracking platforms, emerging supplier nations like Vietnam, and the regulatory frameworks that quietly determine which countries can compete and which cannot. The sections below walk through each layer of this market systematically.
Tracking mango imports in the USA means accessing official customs and trade databases, applying the correct HS Code to filter commodity-specific records, and reading the resulting volume and value figures across time and origin country. The process relies on several publicly accessible government and intergovernmental platforms, each offering a slightly different angle on the same underlying trade flows. Below is a structured breakdown of how to approach this tracking process, from selecting the right data source to applying the correct product classification code.
Specifically, this section addresses the methodology behind import tracking, the key institutional data sources, and the role of the HS Code system in making mango data queryable and comparable.
Five primary data sources are used to monitor U.S. mango import statistics: USDA Economic Research Service (ERS), USITC DataWeb, U.S. Census Bureau Foreign Trade Division, UN Comtrade, and the ITC TradeMap platform. Each source serves a distinct analytical purpose, and together they provide a complete picture of mango trade flows into the American market.
To better understand how each source differs in scope and access, the table below summarizes their key characteristics. This table compares the five major data platforms across update frequency, access type, and primary use case for mango import research:
| Data Source | Update Frequency | Access Type | Primary Use Case |
|---|---|---|---|
| USDA ERS | Annual / periodic | Free | Agricultural supply-demand analysis |
| USITC DataWeb | Monthly and annual | Free | Detailed HS Code-level trade queries |
| U.S. Census Bureau | Monthly | Free | Official U.S. import/export statistics |
| UN Comtrade | Annual (monthly for subscribers) | Free tier + paid | Cross-country bilateral trade comparison |
| ITC TradeMap | Annual | Free (registration required) | Global trade flow mapping by country and product |
Among these, USITC DataWeb is widely regarded as the most granular free tool for U.S.-specific queries. Users can filter by HS Code, origin country, year, and data type (customs value vs. quantity), making it the go-to resource for analysts tracking mango imports at a product-specific level. UN Comtrade and TradeMap are more useful for comparing how different exporting countries perform relative to one another in the U.S. market, as both platforms aggregate bilateral trade data across all WTO member nations.
In terms of update frequency, the U.S. Census Bureau publishes monthly import statistics with a lag of approximately six to eight weeks, offering the most current publicly available data. USDA ERS typically publishes annual summaries with analytical commentary, which is useful for contextualizing short-term fluctuations within longer demand trends.
The HS Code for mangoes imported into the USA is 0804.50, which covers “Guavas, mangoes, and mangosteens, fresh or dried” under the international Harmonized System classification maintained by the World Customs Organization. Within U.S. trade data systems, this 6-digit heading is further broken down into 10-digit Schedule B numbers that distinguish between fresh mangoes, dried mangoes, and related preparations.
More precisely, HS 0804.50.40 applies to fresh mangoes specifically, and this is the sub-heading most commonly used when filtering U.S. import databases for fresh mango shipments. When a user enters this code into USITC DataWeb or the Census Bureau’s USA Trade Online portal, the system returns import quantity (in kilograms or pounds), customs value (in USD), and the country of origin for every recorded shipment within the selected time frame.
Using the HS Code correctly is critical because broader queries at the chapter or heading level (0804) will include guavas and mangosteens, which inflates volume figures. Filtering to the full 10-digit Schedule B number for fresh mangoes gives the cleanest dataset for analysis. For exporters in countries like Vietnam looking to benchmark their potential in the U.S. market, running a query on HS 0804.50.40 through TradeMap or USITC DataWeb immediately shows which competing nations are already shipping, at what volumes, and at what declared unit prices.
The top suppliers of mangoes to the USA are, in order of market share: Mexico, Peru, Brazil, Ecuador, Guatemala, and Haiti, with Mexico alone accounting for more than 80% of total import volume in most years. This concentration reflects decades of trade relationship development, geographic advantages, and the deep integration of Mexican mango supply chains with U.S. distribution networks.
The table below summarizes the key characteristics of each major supplying country, comparing their estimated market share, primary mango varieties, and peak export season into the U.S. market. This comparison helps clarify not only who supplies the most volume but also how each country fits into the seasonal supply calendar:
| Country | Estimated Market Share | Key Mango Varieties | Peak U.S. Export Season |
|---|---|---|---|
| Mexico | ~80%+ | Tommy Atkins, Ataulfo, Kent, Keitt | March to September |
| Peru | ~8 to 10% | Kent, Tommy Atkins, Keitt, Haden | December to March |
| Brazil | ~3 to 5% | Tommy Atkins, Palmer, Kent | September to January |
| Ecuador | ~2 to 4% | Tommy Atkins, Kent | October to February |
| Guatemala | ~1 to 3% | Tommy Atkins, Haden | March to June |
| Haiti | Under 1% | Francis, Tommy Atkins | April to July |
Following this overview, the next two sections examine why Mexico holds such a commanding position and how the remaining suppliers compare in terms of competitive positioning.
Mexico dominates U.S. mango imports because of four compounding advantages: geographic proximity that reduces freight costs and transit time, a zero-tariff preferential rate under the USMCA agreement, a growing season that spans more than half the calendar year, and decades of established supply chain infrastructure connecting Mexican orchards to U.S. distribution centers. No other supplying country currently combines all four of these factors simultaneously.
Specifically, Mexico’s Pacific Coast states (Nayarit, Sinaloa, Jalisco) and Gulf Coast states (Veracruz, Chiapas, Oaxaca) produce mangoes in a rolling sequence, meaning the Mexican supply window stretches from approximately March through September. This extended domestic season allows Mexican exporters to fill U.S. supermarket shelves for the majority of the year without competition from more distant origins.
Under USMCA (previously NAFTA), Mexican mangoes enter the United States at a 0% import duty rate, a significant structural advantage over countries operating under the standard Most Favored Nation (MFN) tariff. Combined with short overland trucking routes from border crossing points in Texas, Arizona, and California, Mexico’s landed cost per kilogram is consistently lower than that of competitors shipping by sea from South America.
The primary mango varieties driving Mexican export volume include:
According to the National Mango Board (NMB) and USDA import data, Mexico consistently ships between 700 million and 900 million pounds of mangoes to the U.S. annually, representing the single largest bilateral fruit trade relationship in the fresh mango category.
Peru ranks second, Brazil third, and Ecuador fourth as U.S. mango suppliers, but all three remain far below Mexico in volume terms, each capturing single-digit percentage shares of total import value. Their key competitive advantage is seasonal complementarity: they supply the U.S. market primarily during the October-to-March window when Mexican production is minimal, rather than competing head-to-head during peak season.
In contrast to Mexico’s overland logistics model, Peru, Brazil, and Ecuador all ship by ocean freight, which adds transit time of approximately 7 to 20 days depending on port of origin. This extended cold-chain exposure requires careful post-harvest management and limits the types of mango varieties that are commercially viable for export.
Peru has grown the most rapidly among the secondary suppliers over the past decade. Peruvian mango exports to the USA peak between December and March, positioning Peru as the primary source of fresh mangoes during the U.S. winter months. Kent and Tommy Atkins dominate Peruvian shipments, and the country benefits from a preferential tariff rate under the U.S.-Peru Trade Promotion Agreement (PTPA), which mirrors the zero-duty structure that Mexico enjoys under USMCA.
Brazil and Ecuador together fill the shoulder seasons (September through January and October through February, respectively), but face higher logistics costs and more variable quality consistency relative to Peru. Guatemala and Haiti contribute smaller volumes, primarily supplying ethnic specialty markets and food service distributors rather than major retail chains.
The fundamental reason none of these countries have meaningfully closed the gap with Mexico is that volume, seasonality advantage, tariff parity, and logistics cost would all need to align simultaneously. Peru has made the most progress on the tariff and volume dimensions, but geographic distance remains a structural constraint that cannot be eliminated through trade policy alone.
U.S. mango import volume has ranged between approximately 900 million and 1.1 billion pounds annually in recent years, with a corresponding trade value of roughly 800 million to 1.2 billion USD, reflecting both growing consumer demand and fluctuating logistics and commodity costs. These figures are drawn from USDA ERS supply-use data and USITC DataWeb customs records, both of which track fresh mango imports separately from dried and processed mango products under HS Code 0804.50.
The sustained growth in import volume over the past decade is driven by three converging demand signals: the expansion of the U.S. Hispanic consumer base (which has a strong cultural affinity for mango consumption), a broader health and wellness trend favoring tropical fruits, and improved cold-chain infrastructure that has made fresh mangoes accessible in inland U.S. markets that previously relied on frozen or processed alternatives.
U.S. mango import volume has followed an overall upward trend from 2019 to 2024, with a notable disruption in 2020 due to COVID-19 supply chain disruptions, followed by a strong recovery and record-level imports in 2022 and 2023. The table below presents estimated annual import volumes based on USDA and USITC data records. This volume data illustrates how the market has responded to both external shocks and underlying demand growth over the five-year period:
| Year | Estimated Import Volume (million lbs) | Key Influencing Factor |
|---|---|---|
| 2019 | ~935 | Steady baseline demand |
| 2020 | ~870 | COVID-19 logistics disruptions, reduced foodservice demand |
| 2021 | ~960 | Recovery in retail demand, resumption of supply chains |
| 2022 | ~1,050 | Record consumer demand, strong Hispanic market growth |
| 2023 | ~1,090 | Continued growth, easing freight costs |
| 2024 | ~1,000 to 1,050 | Normalization after peak; inflation impact on discretionary spending |
More importantly, the 2020 dip was followed by one of the steepest multi-year recoveries in fresh mango trade history, with 2022 and 2023 volumes surpassing pre-pandemic levels by a meaningful margin. This trajectory reflects structural demand growth rather than purely cyclical recovery.
The seasonality of import volume follows a predictable annual pattern. Peak import months cluster between April and August, corresponding to the heart of Mexico’s mango harvest season. Volume typically drops in November and December before recovering as Peruvian and Brazilian supplies enter the market in January. This seasonal rhythm is an important planning variable for importers setting inventory levels and for exporters from emerging origin countries deciding when to target U.S. market entry.
According to the National Mango Board, per capita mango consumption in the United States has risen consistently over the past 20 years, supported by demographic change and the fruit’s growing presence in mainstream retail formats including Walmart, Costco, and Trader Joe’s.
The total value of U.S. mango imports has grown from approximately 700 million USD in 2019 to an estimated 1 billion to 1.2 billion USD range in 2022 and 2023, with Mexico accounting for the largest absolute value contribution due to its dominant volume share. However, a more nuanced story emerges when value is analyzed on a per-unit basis across supplying countries.
The table below breaks down estimated import value by major supplying country and approximate unit price per kilogram. Analyzing value alongside volume per supplier reveals which countries are capturing premium pricing versus competing primarily on cost:
| Country | Estimated Annual Import Value (USD) | Approx. Unit Value (USD/kg) | Value Positioning |
|---|---|---|---|
| Mexico | ~700 to 900 million | ~0.80 to 1.10 | High volume, moderate unit price |
| Peru | ~60 to 90 million | ~1.10 to 1.50 | Lower volume, higher unit price |
| Brazil | ~20 to 40 million | ~1.00 to 1.40 | Moderate unit price |
| Ecuador | ~15 to 25 million | ~0.90 to 1.20 | Competitive pricing |
| Guatemala | ~10 to 20 million | ~0.85 to 1.10 | Cost-competitive, lower quality perception |
| Haiti | Under 10 million | ~0.70 to 0.90 | Lowest unit value, specialty/ethnic market |
Peru’s notably higher unit value per kilogram, despite its much lower total volume, reflects two factors: a higher proportion of premium Kent variety exports, and the longer cold-chain transit required from South America that selects for more expensive, better-managed shipments. This dynamic suggests that emerging supplier countries with premium or differentiated varieties may be able to compete on value even if they cannot immediately match Mexico’s volume.
Furthermore, the overall trend in import value has outpaced the growth in import volume, meaning that average unit prices have risen over the 2019-to-2024 period. This price inflation reflects the combined effect of higher ocean freight costs (particularly in 2021 and 2022), rising farm-gate prices in key producing countries, and the partial shift of consumer preferences toward premium varieties such as Ataulfo and Kent that command higher retail prices than standard Tommy Atkins shipments.
Yes, real-time tools to track U.S. mango import shipments by supplier do exist, and the most widely used platforms include Panjiva (by S&P Global), ImportGenius, Volza, Descartes Datamyne, and Flexport’s trade intelligence features. These platforms aggregate U.S. Customs and Border Protection (CBP) Bill of Lading data, making it possible to search individual shipments by supplier name, port of entry, commodity description, or HS Code.
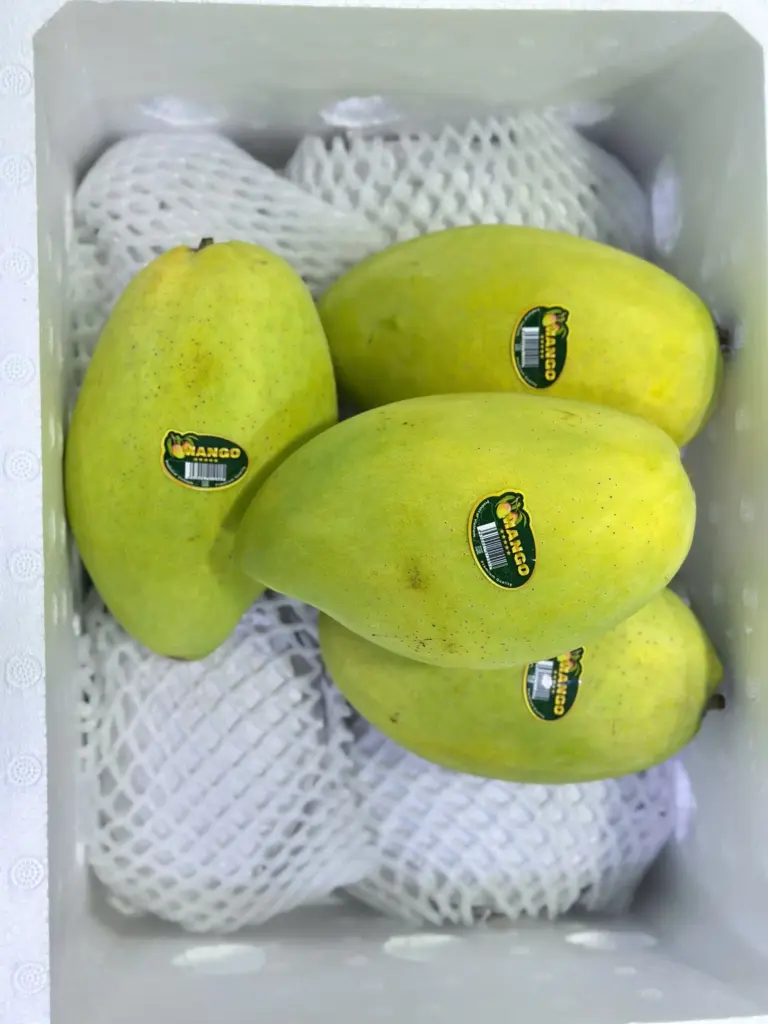
Vietnam can realistically become a competitive mango supplier to the USA in the premium and specialty segment, though it currently holds a very small share of the U.S. mango import market. USDA APHIS has approved Vietnamese mangoes for entry into the United States, subject to vapor heat treatment (VHT) as a phytosanitary condition, and Vietnam’s signature varieties, including Cát Hòa Lộc and Cát Chu, offer flavor profiles and market differentiation that standard commercial varieties from Mexico and Peru cannot replicate.
The core challenge is logistics cost and scale. Vietnam’s geographic distance from the U.S. East and West Coasts translates into significantly higher ocean freight expenses than those faced by Mexico or even Peru. For Vietnamese mango exports to be commercially viable in the U.S. market, exporters must target the premium or organic/exotic segment where higher unit prices justify the additional freight burden.
This is precisely the positioning that companies like GOBE IMEX (Golden Bee Vietnam), a Vietnamese exporter specializing in tropical fresh fruits and vegetables with established networks across North America, Europe, and the Middle East, are well-placed to pursue. With GlobalGAP, ISO, and FDA certifications already in place, and a packing house in Tien Giang that processes fruit within 12 hours of harvest, GOBE IMEX represents the type of vertically integrated Vietnamese supplier capable of meeting the quality and documentation requirements that U.S. importers demand.
The micro-context shift here is significant: while dominant suppliers like Mexico compete on volume and price, emerging suppliers from Vietnam can position themselves as the antonym of that model, competing on provenance, variety uniqueness, and traceability.
Tariffs and phytosanitary rules are among the most consequential non-volume factors shaping which countries can competitively supply mangoes to the U.S. market, and they create a tiered competitive structure that the raw volume and value statistics alone do not reveal.
On the tariff dimension, Mexico and Peru both benefit from preferential zero-duty access under USMCA and the U.S.-Peru Trade Promotion Agreement respectively. Most other mango-exporting countries, including Brazil, Ecuador, Haiti, and Vietnam, currently ship under the Most Favored Nation (MFN) duty rate, which for fresh mangoes stands at approximately 0% to 2.2% depending on the specific Schedule B classification. While the tariff differential is relatively modest in percentage terms, it becomes meaningful at the scale of millions of kilograms shipped annually.
On the phytosanitary side, USDA APHIS requirements are stricter and more operationally demanding. Countries exporting mangoes to the USA that are identified as hosts of the Mediterranean fruit fly, mango seed weevil, or other quarantine pests must treat shipments before export. The primary approved treatment is vapor heat treatment (VHT), which requires certified treatment facilities at or near the packing house. Countries like Vietnam, India, and several others must invest in VHT infrastructure and USDA-approved protocols before any commercial volume can legally enter the U.S. market. This regulatory requirement functions as a meaningful market access barrier that goes beyond simply being able to grow and harvest an exportable mango crop.
For emerging suppliers evaluating U.S. market entry, the combined tariff and phytosanitary compliance cost must be factored into unit economics from day one. Countries that have already cleared these regulatory hurdles, and can demonstrate consistent compliance record with USDA inspectors, gain a durable competitive advantage over those still building that compliance infrastructure.